1.获取文件名,行号,函数名
xdebug_call_class()
1
2
3
4
5
6
7
8
9
10
11
12
13
| <?php
function fix_string($a)
{
echo "Called @ ".
xdebug_call_file().
":".
xdebug_call_line().
" from ".
xdebug_call_function();
}
$ret = fix_string(array('Derick'));
?>
|
输出:
Called @ /var/www/xdebug_caller.php:12 from {main}
2.输出head信息
xdebug_get_headers()
1
2
3
4
5
| <?php
header("X-Test", "Testing");
setcookie("TestCookie","test-value");
var_dump(xdebug_get_headers());
?>
|
输出:
1
2
3
4
5
6
| array(2) {
[0]=>
string(6) "X-Test"
[1]=>
string(33) "Set-Cookie: TestCookie=test-value"
}
|
3.输出执行时间
xdebug_time_index()
1
2
3
4
5
6
7
8
| <?php
echo xdebug_time_index(), "\n";
for ($i = 0; $i < 250000; $i++)
{
}
echo xdebug_time_index(), "\n";
?>
|
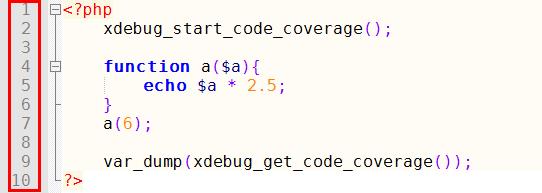
4.统计代码覆盖率
1
2
3
4
5
6
7
8
9
10
| <?php
xdebug_start_code_coverage();
function a($a){
echo $a * 2.5;
}
a(6);
var_dump(xdebug_get_code_coverage());
?>
|
输出:
1
2
3
4
5
6
7
8
9
10
| 15
array (size=1)
'E:\wamp\www\test\a.php' =>
array (size=5)
4 => int 1
5 => int 1
6 => int 1
7 => int 1
9 => int 1
|
5.代码跟踪
需要跟踪的代码:
1
2
3
4
5
6
7
8
9
10
11
12
13
14
15
16
| <?php
class myClass{
public function a($a) {
echo $a * 2.5;
}
public function b($b) {
$this->a($b + 2);
}
}
xdebug_start_trace('trace');
$obj=new myClass();
$obj->b(6);
echo "</br>";
xdebug_stop_trace();
?>
|
xdebug配置参考
1
2
3
4
5
6
7
8
9
10
11
12
13
14
15
16
17
18
19
20
21
| xdebug.default_enable = On
xdebug.show_exception_trace = On
xdebug.show_local_vars = 1
xdebug.max_nesting_level = 50
xdebug.var_display_max_depth = 6
xdebug.dump_once = On
xdebug.dump_globals = On
xdebug.dump_undefined = On
xdebug.dump.REQUEST = *
xdebug.dump.SERVER = REQUEST_METHOD,REQUEST_URI,HTTP_USER_AGENT
xdebug.trace_format = 0
xdebug.auto_trace = On
xdebug.trace_output_dir = E:\xampp\tmp\traces
xdebug.trace_output_name = trace.%c.%p
xdebug.collect_params = 4
xdebug.collect_includes = On
xdebug.collect_return = On
xdebug.show_mem_delta = On
|
设置xdebug.auto_trace = Off可在代码中添加xdebug_start_trace();xdebug_stop_trace();语句生成追踪文件。
使用xdebug_start_trace跟踪代码执行
1
| xdebug_start_trace('trace');$a->myCaller($b);xdebug_stop_trace();TRACE START [16:53:57]0.0010 57964 -> MyClass->myCaller() /code/xdebug.php:210.0011 58104 -> MyOther->myCallee() /code/xdebug.php:40.0011 58104 -> xdebug_call_class() /code/xdebug.php:100.0011 58128 -> printf() /code/xdebug.php:100.0014 58196 -> xdebug_call_function() /code/xdebug.php:110.0015 58196 -> printf() /code/xdebug.php:110.0016 58196 -> xdebug_call_file() /code/xdebug.php:120.0016 58244 -> printf() /code/xdebug.php:120.0017 58244 -> xdebug_call_line() /code/xdebug.php:130.0017 58244 -> printf() /code/xdebug.php:130.0018 58244 -> xdebug_stop_trace() /code/xdebug.php:220.0019 58244TRACE END [16:53:57]
|