PHP Mongodb API参考
去掉wget烦人的 “eta(英国中部时间)” 提示
出现这个问题是因为,eta翻译文件里面翻译成 “英文中部时间”导致出现很多行代码的问题。我们需要把该文件翻译回去去掉英文中部时间
检查翻译命令 msgunfmit是不是有,如下图输入补全。或者运行命令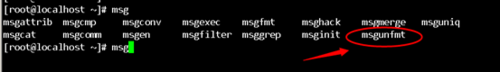
mysql非常全的和完整的总结
数据类型
| 类型 | 备注 |
|---|---|
| tinyint/smallint/mediumint/int/bigint | 1B/2B/3B/4B/8B |
| float/double | 单精度/双精度浮点型 |
| decimal | 不会产生精度丢失的单精度/双精度浮点型 |
| date | 日期类型 |
| time | 时间类型 |
| datetime/TimeStamp | 日期时间类型/TimeStamp(登录时间,自动填充) |
| year | 年类型 |
| char | 定长字符串类型 |
| varchar | 可变长字符串类型 |
| tinyblob/blob/mediumblob/longblob | 255B/64K/16M/4G大小图片/音乐二进行数据 |
| tinytext/text/mediumtext/longtext | 255B/64K/16M/4G大小的文本数据 |
php之mongodb插入数据后如何返回当前插入记录ID
1 |
|
如上所示,参数$record实际上是个指针引用,当插入成功后$record数组中就会自动返回_id键
使用PHP导入和导出CSV文件
项目开发中,很多时候要将外部CSV文件导入到数据库中或者将数据导出为CSV文件,那么具体该如何实现呢?本文将使用PHP并结合mysql,实现了CSV格式数据的导入和导出功能。
下载源码
我们先准备mysql数据表,假设项目中有一张记录学生信息的表student,并有id,name,sex,age分别记录学生的姓名、性别、年龄等信息。
1 | CREATE TABLE `student` ( |